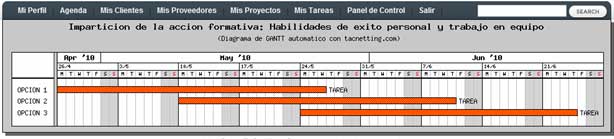
tacnetting generates GANTT diagrams automatically . It is important to plan properly the tasks to be performed by each participant. The diagrams are created such as planning progresses.
In project management, Gantt diagram shows the origin and end of tasks and phases (task forces). Gantt charts have become a key tool in managing projects of all kinds, in order to represent the different phases, tasks and activities planned as part of a project or to display a line of time in the various activities making the most efficient method